Five standard reports are available for the defects in a Test cycle . If desired, you can filter by test type in these reports. For example, do you want to report on the defects from User Acceptance Test? Then choose this test type in the report.
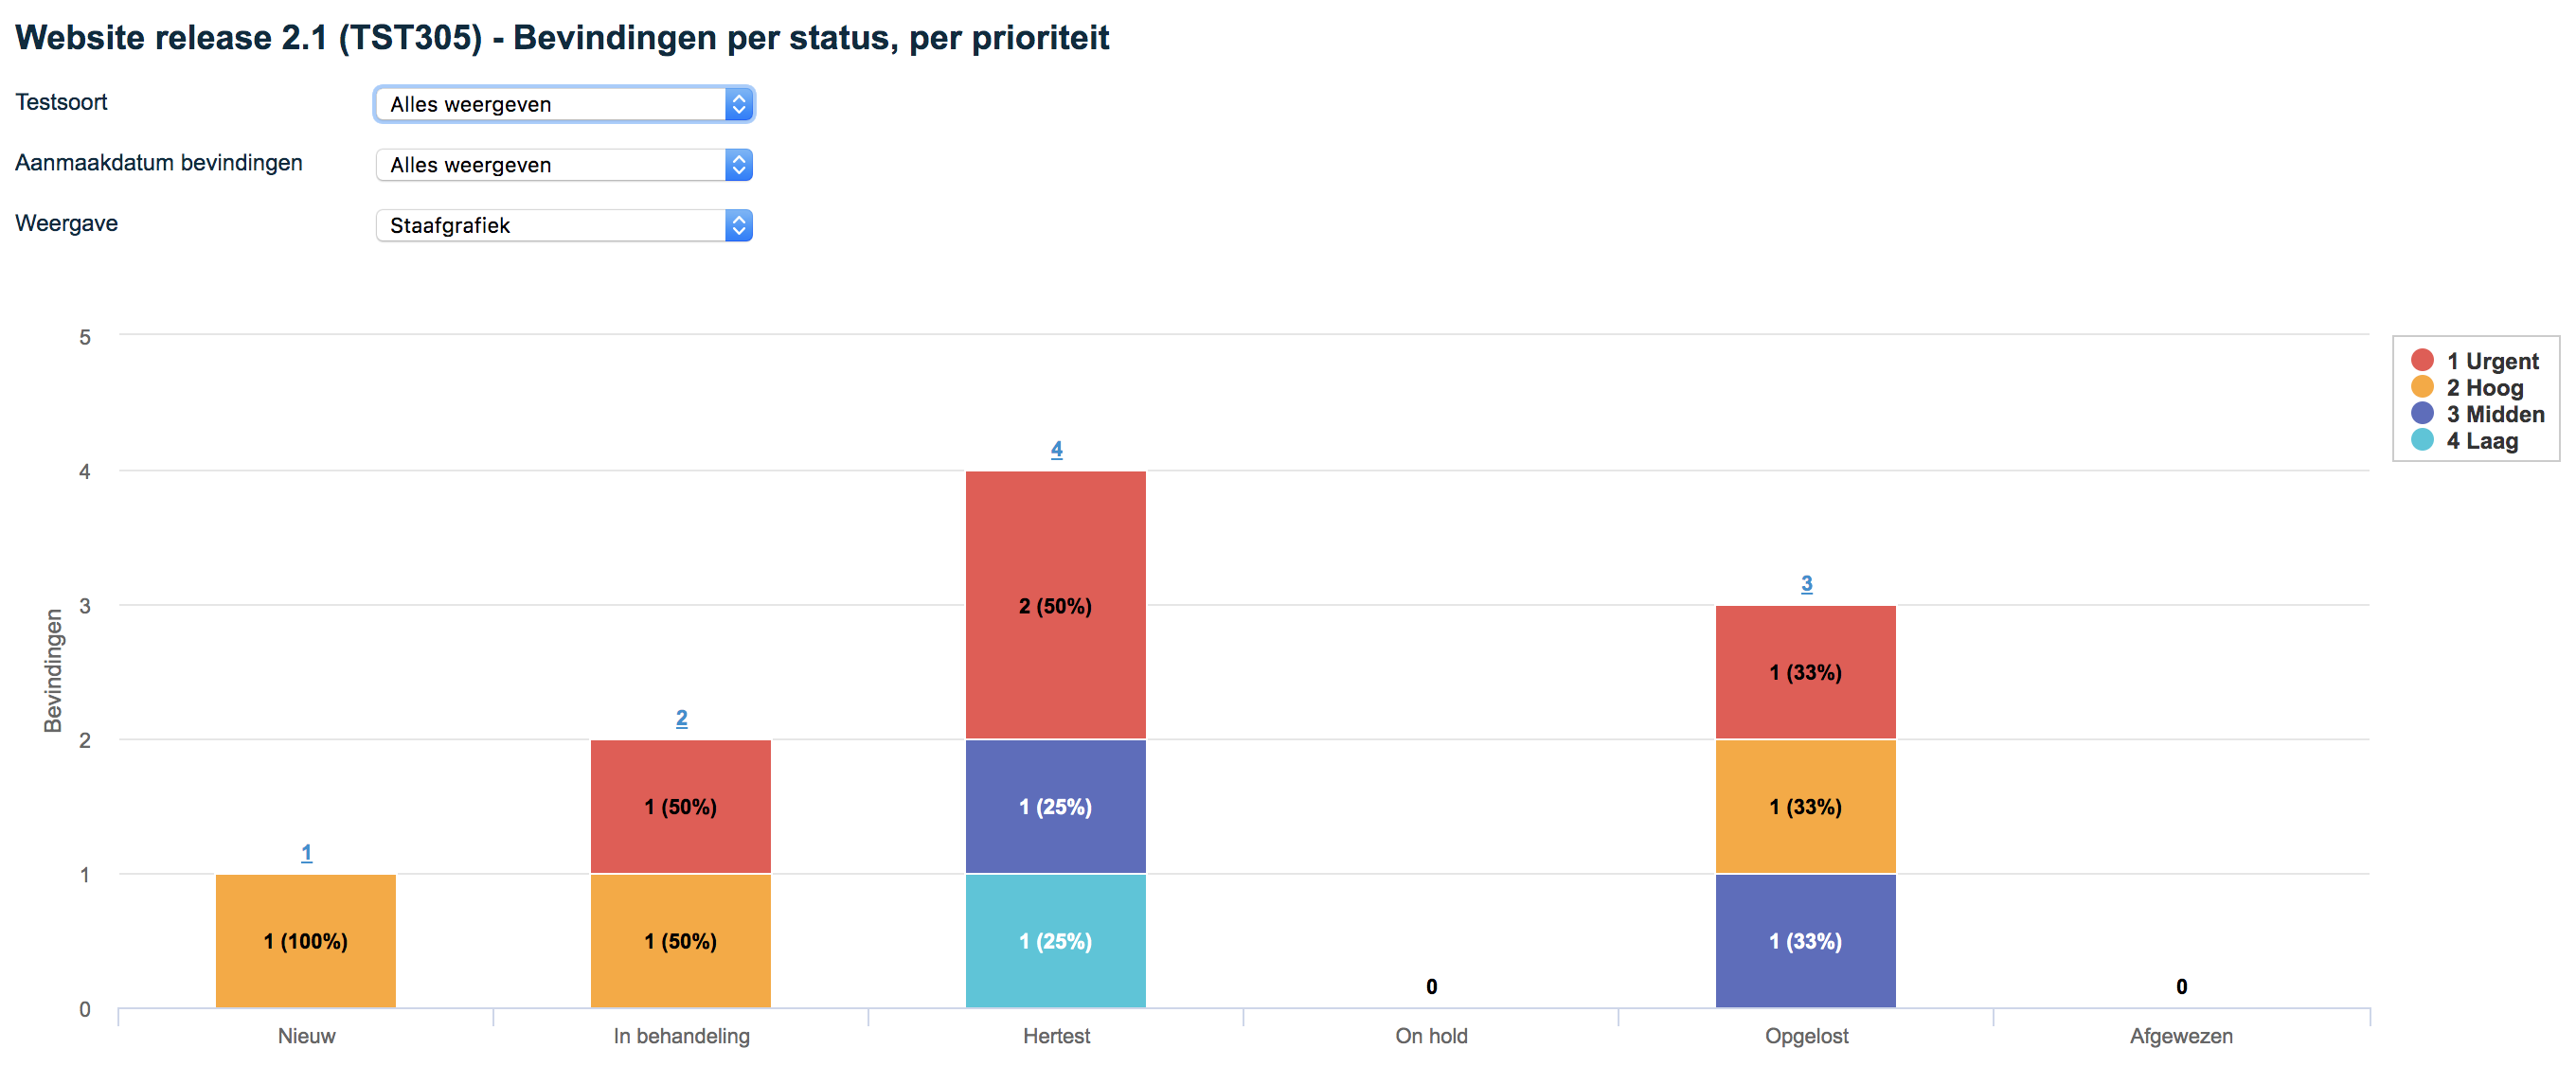
1. defects by status, by priority
This report shows the number of defects by status and priority.
At the top of the report you can filter by:
- Test Type (Unit Test, System Test, etc.).
- Creation date defect (All, Today or Period)
Display options: Bar chart, Table
The bar graph provides an additional option for filtering by clicking on and off items in the legend on the right side of the graph.
Example of this report:
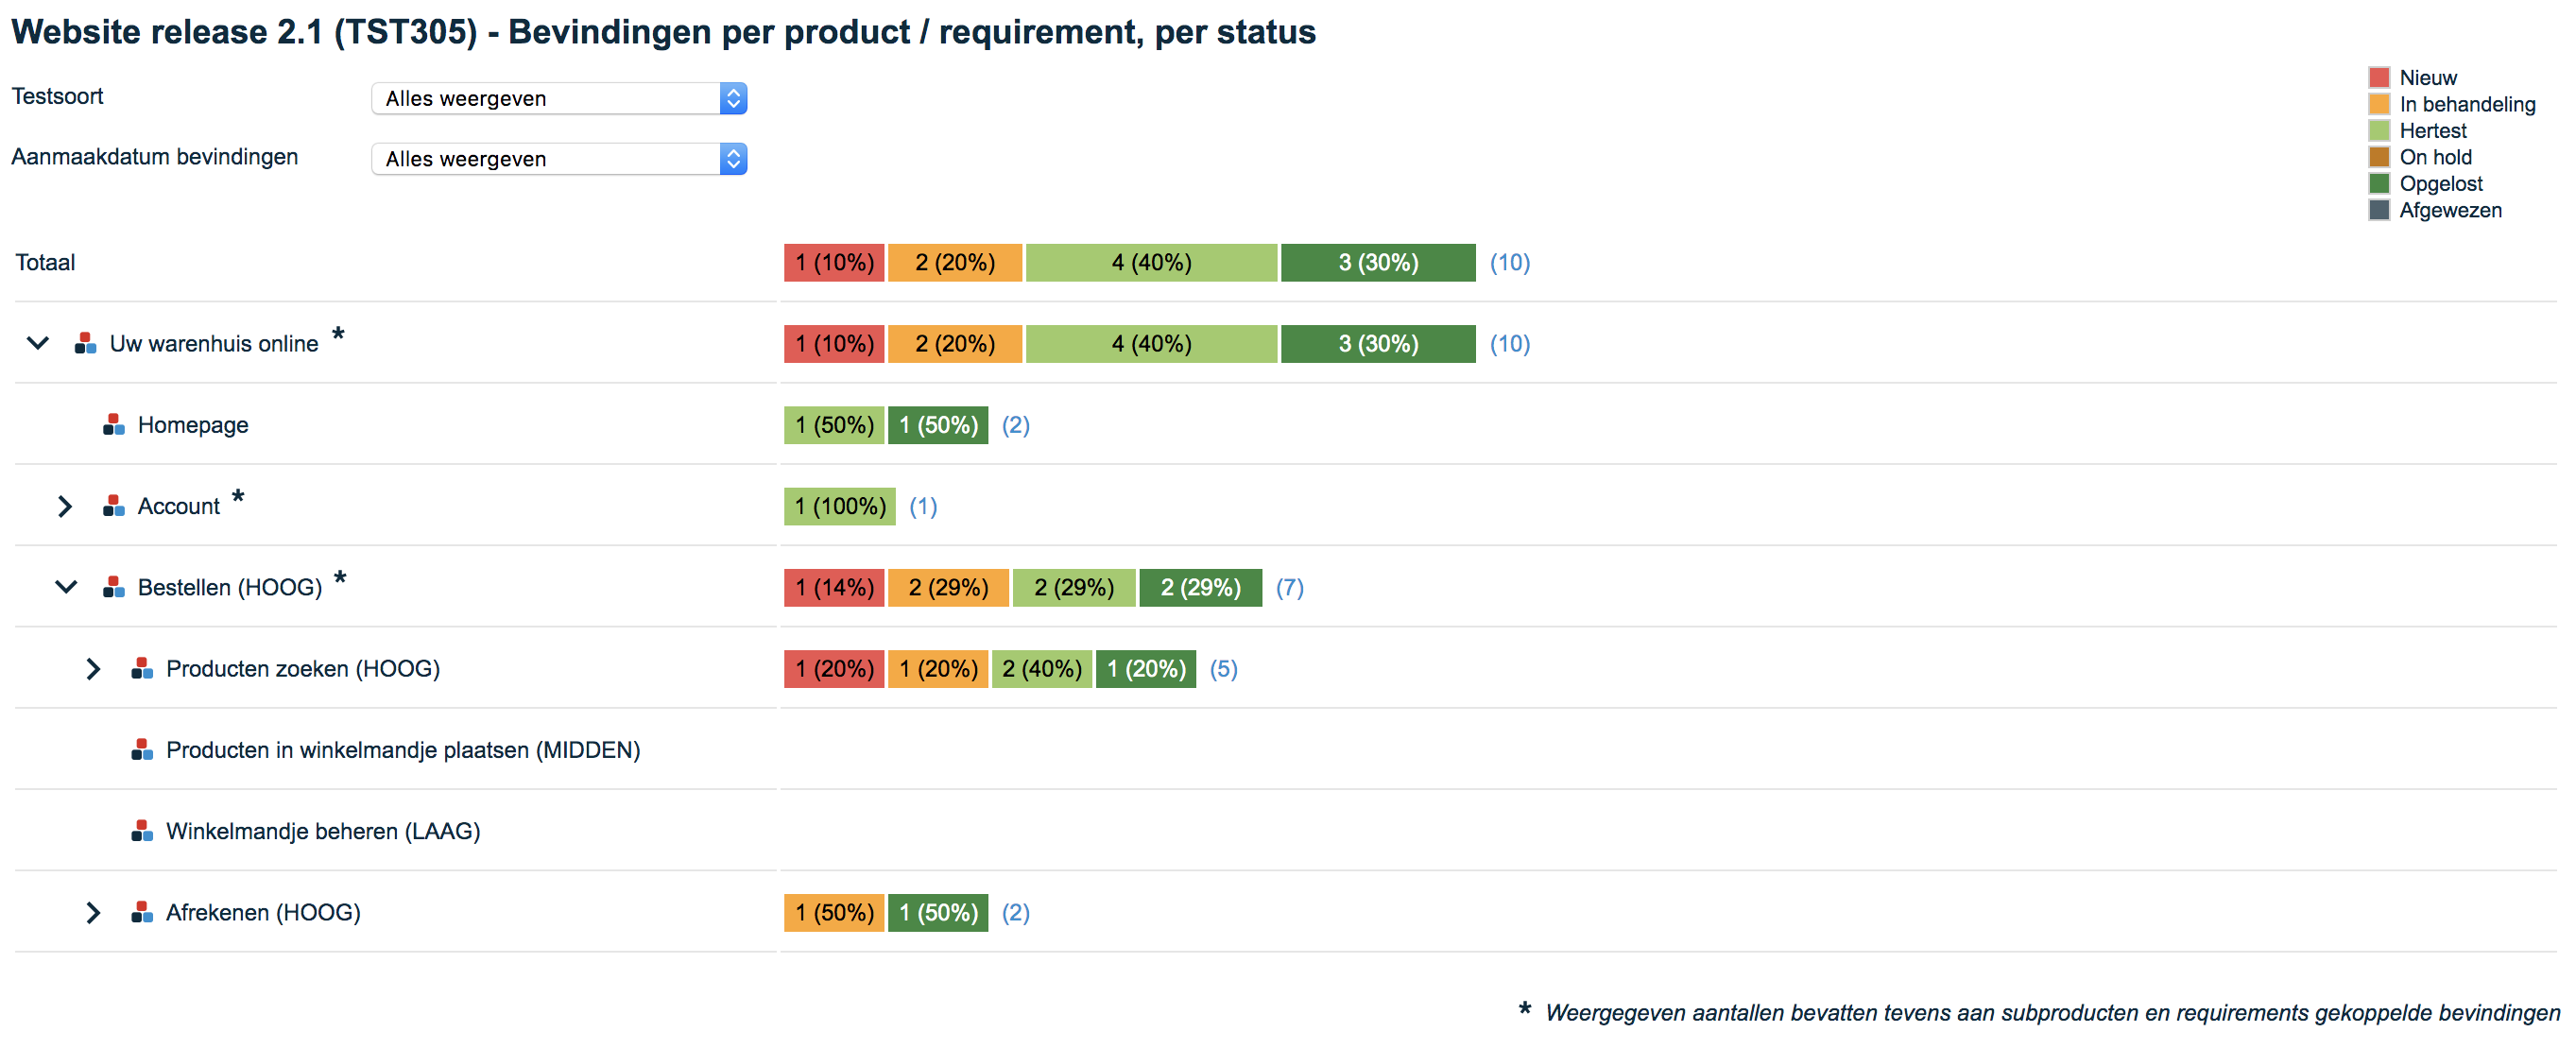
2. defects by product/requirement, by status
This report shows the number of defects per product and requirement per status. Thereby the numbers are cumulated upwards.
At the top of the report you can filter by:
- Test Type (Unit Test, System Test, etc.).
- Creation date defect (All, Today or Period)
Example of this report:
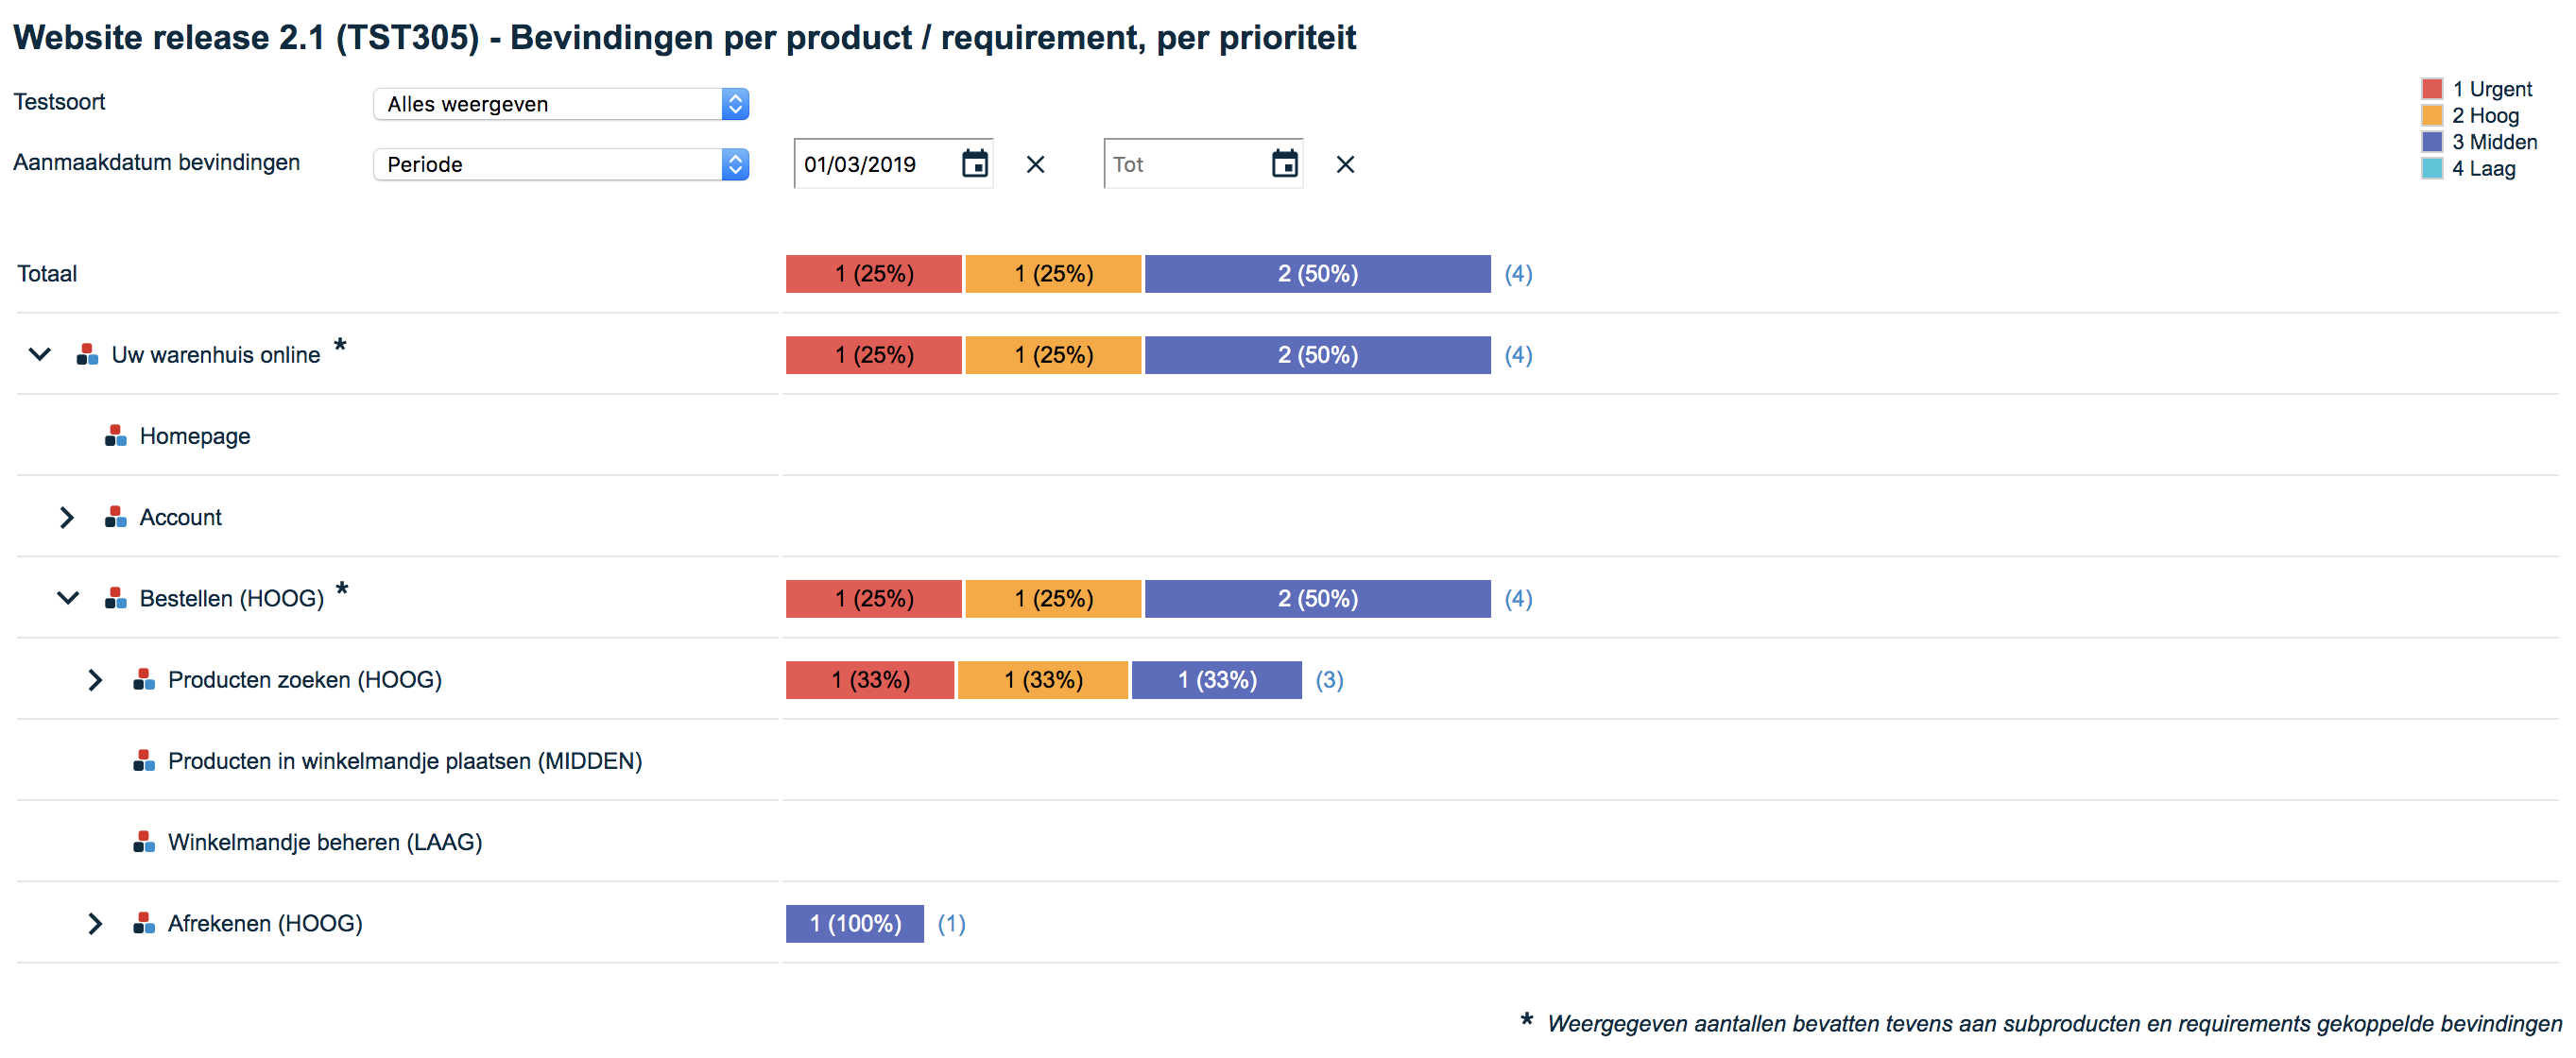
3. defects by product/requirement, by priority
This report shows the number of defects per product and requirement per priority. Thereby the numbers are cumulated upwards.
At the top of the report you can filter by:
- Test Type (Unit Test, System Test, etc.).
- Creation date defect (All, Today or Period)
Example of this report:
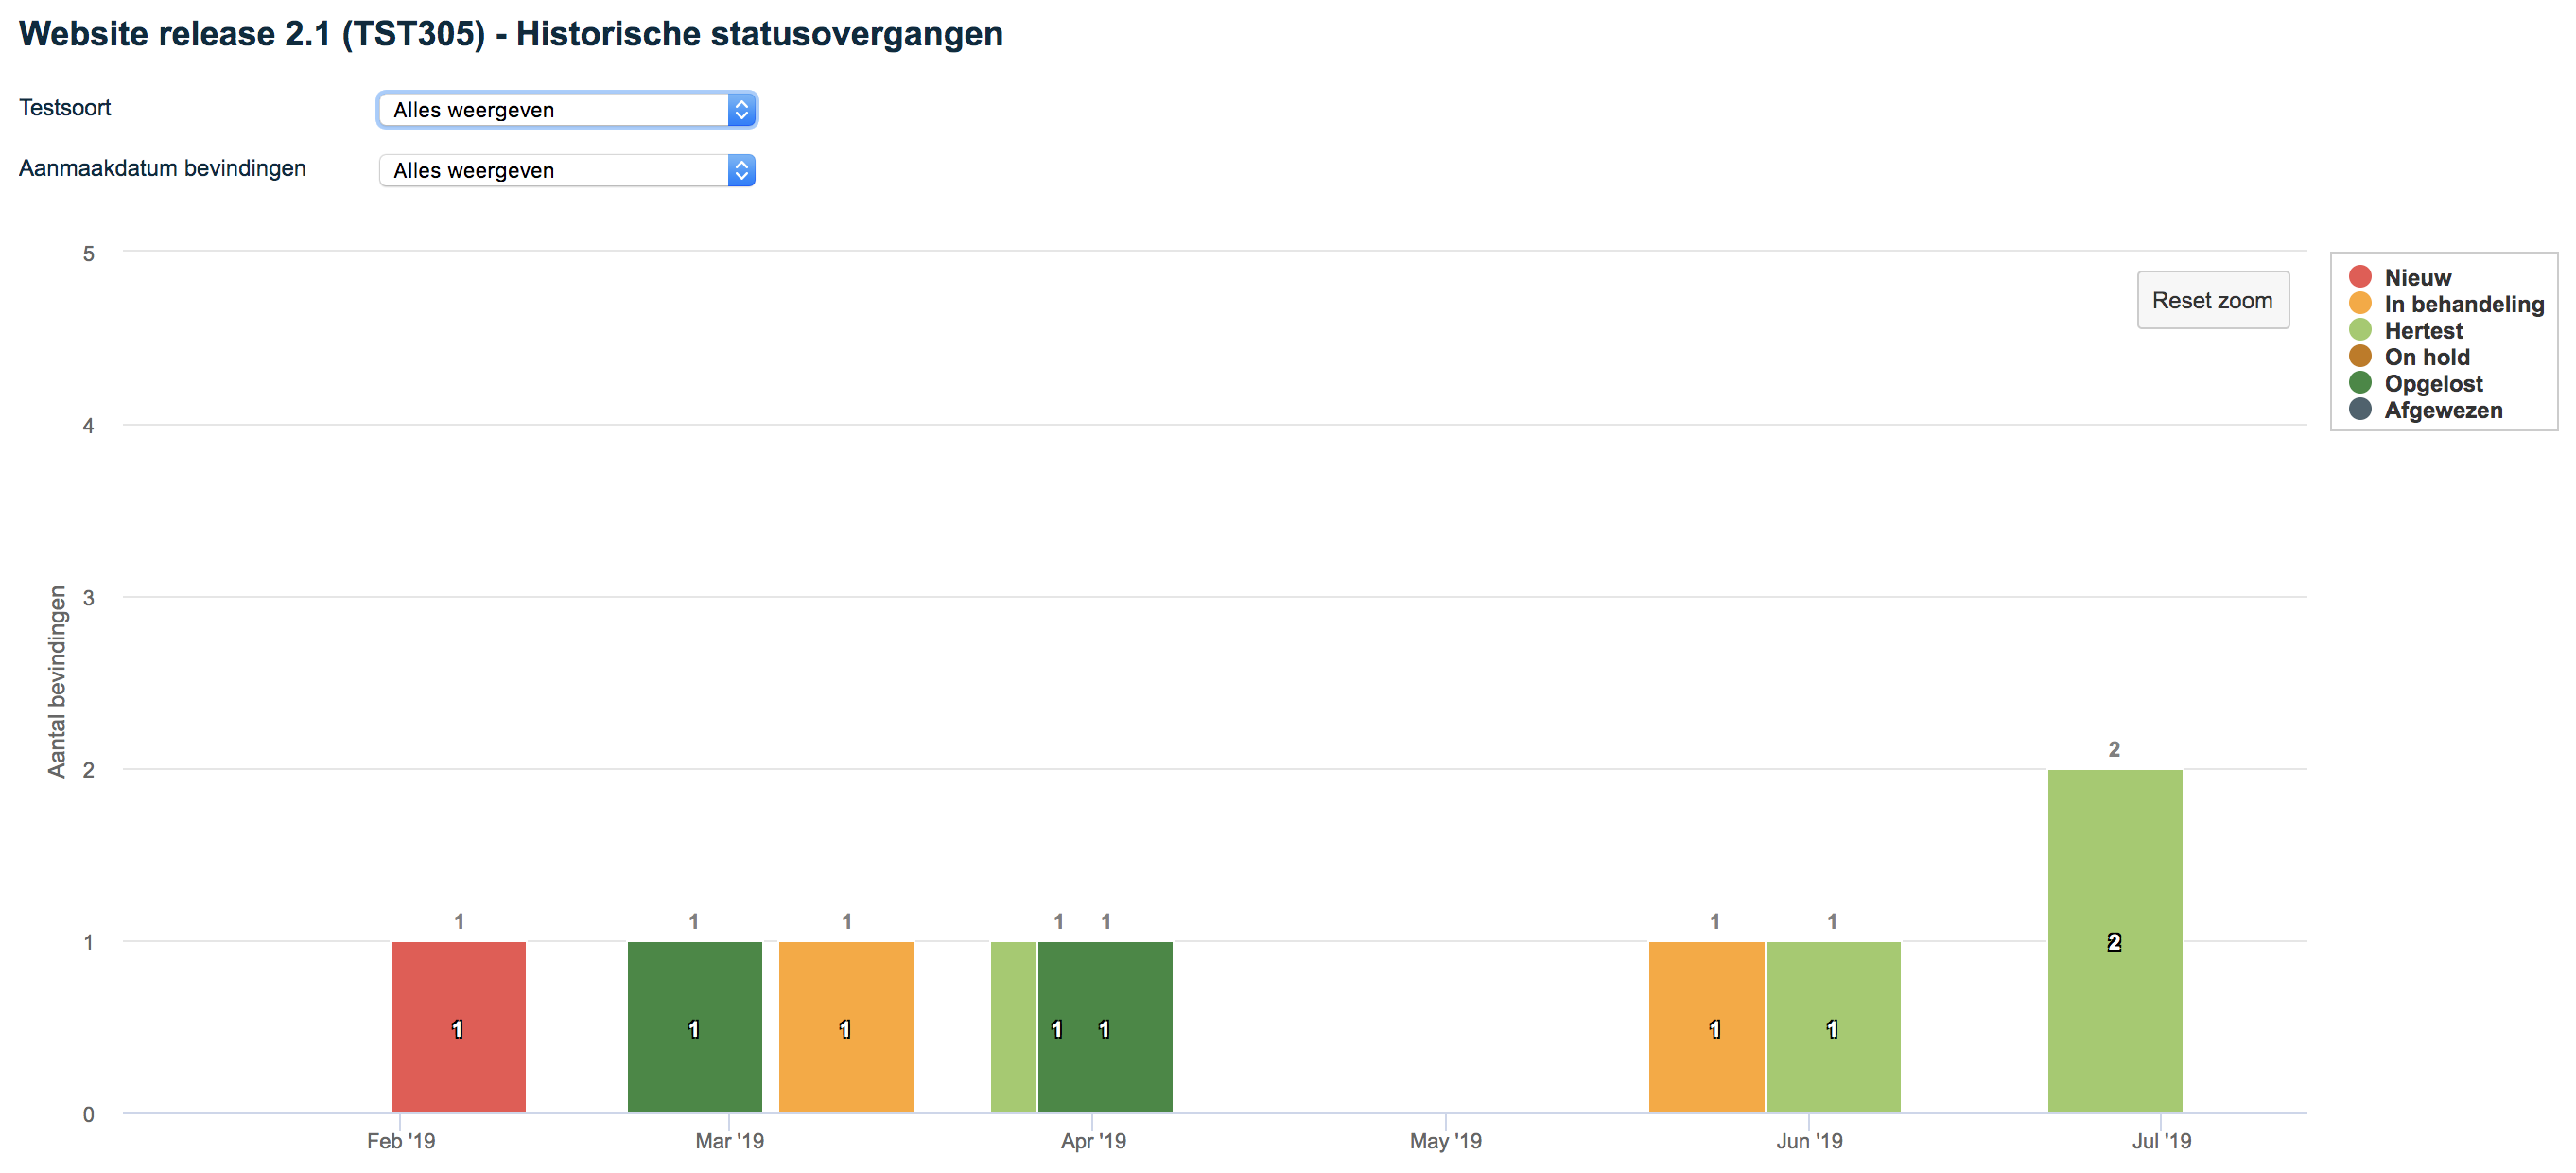
4. Historical status transitions.
This report provides a historical summary of status transitions (changes) by day.
At the top of the report you can filter by:
- Test Type (Unit Test, System Test, etc.).
- Creation date defect (All, Today or Period)
This graph provides an additional option for filtering by clicking on and off the items in the legend on the right side of the graph.
Example of this report:
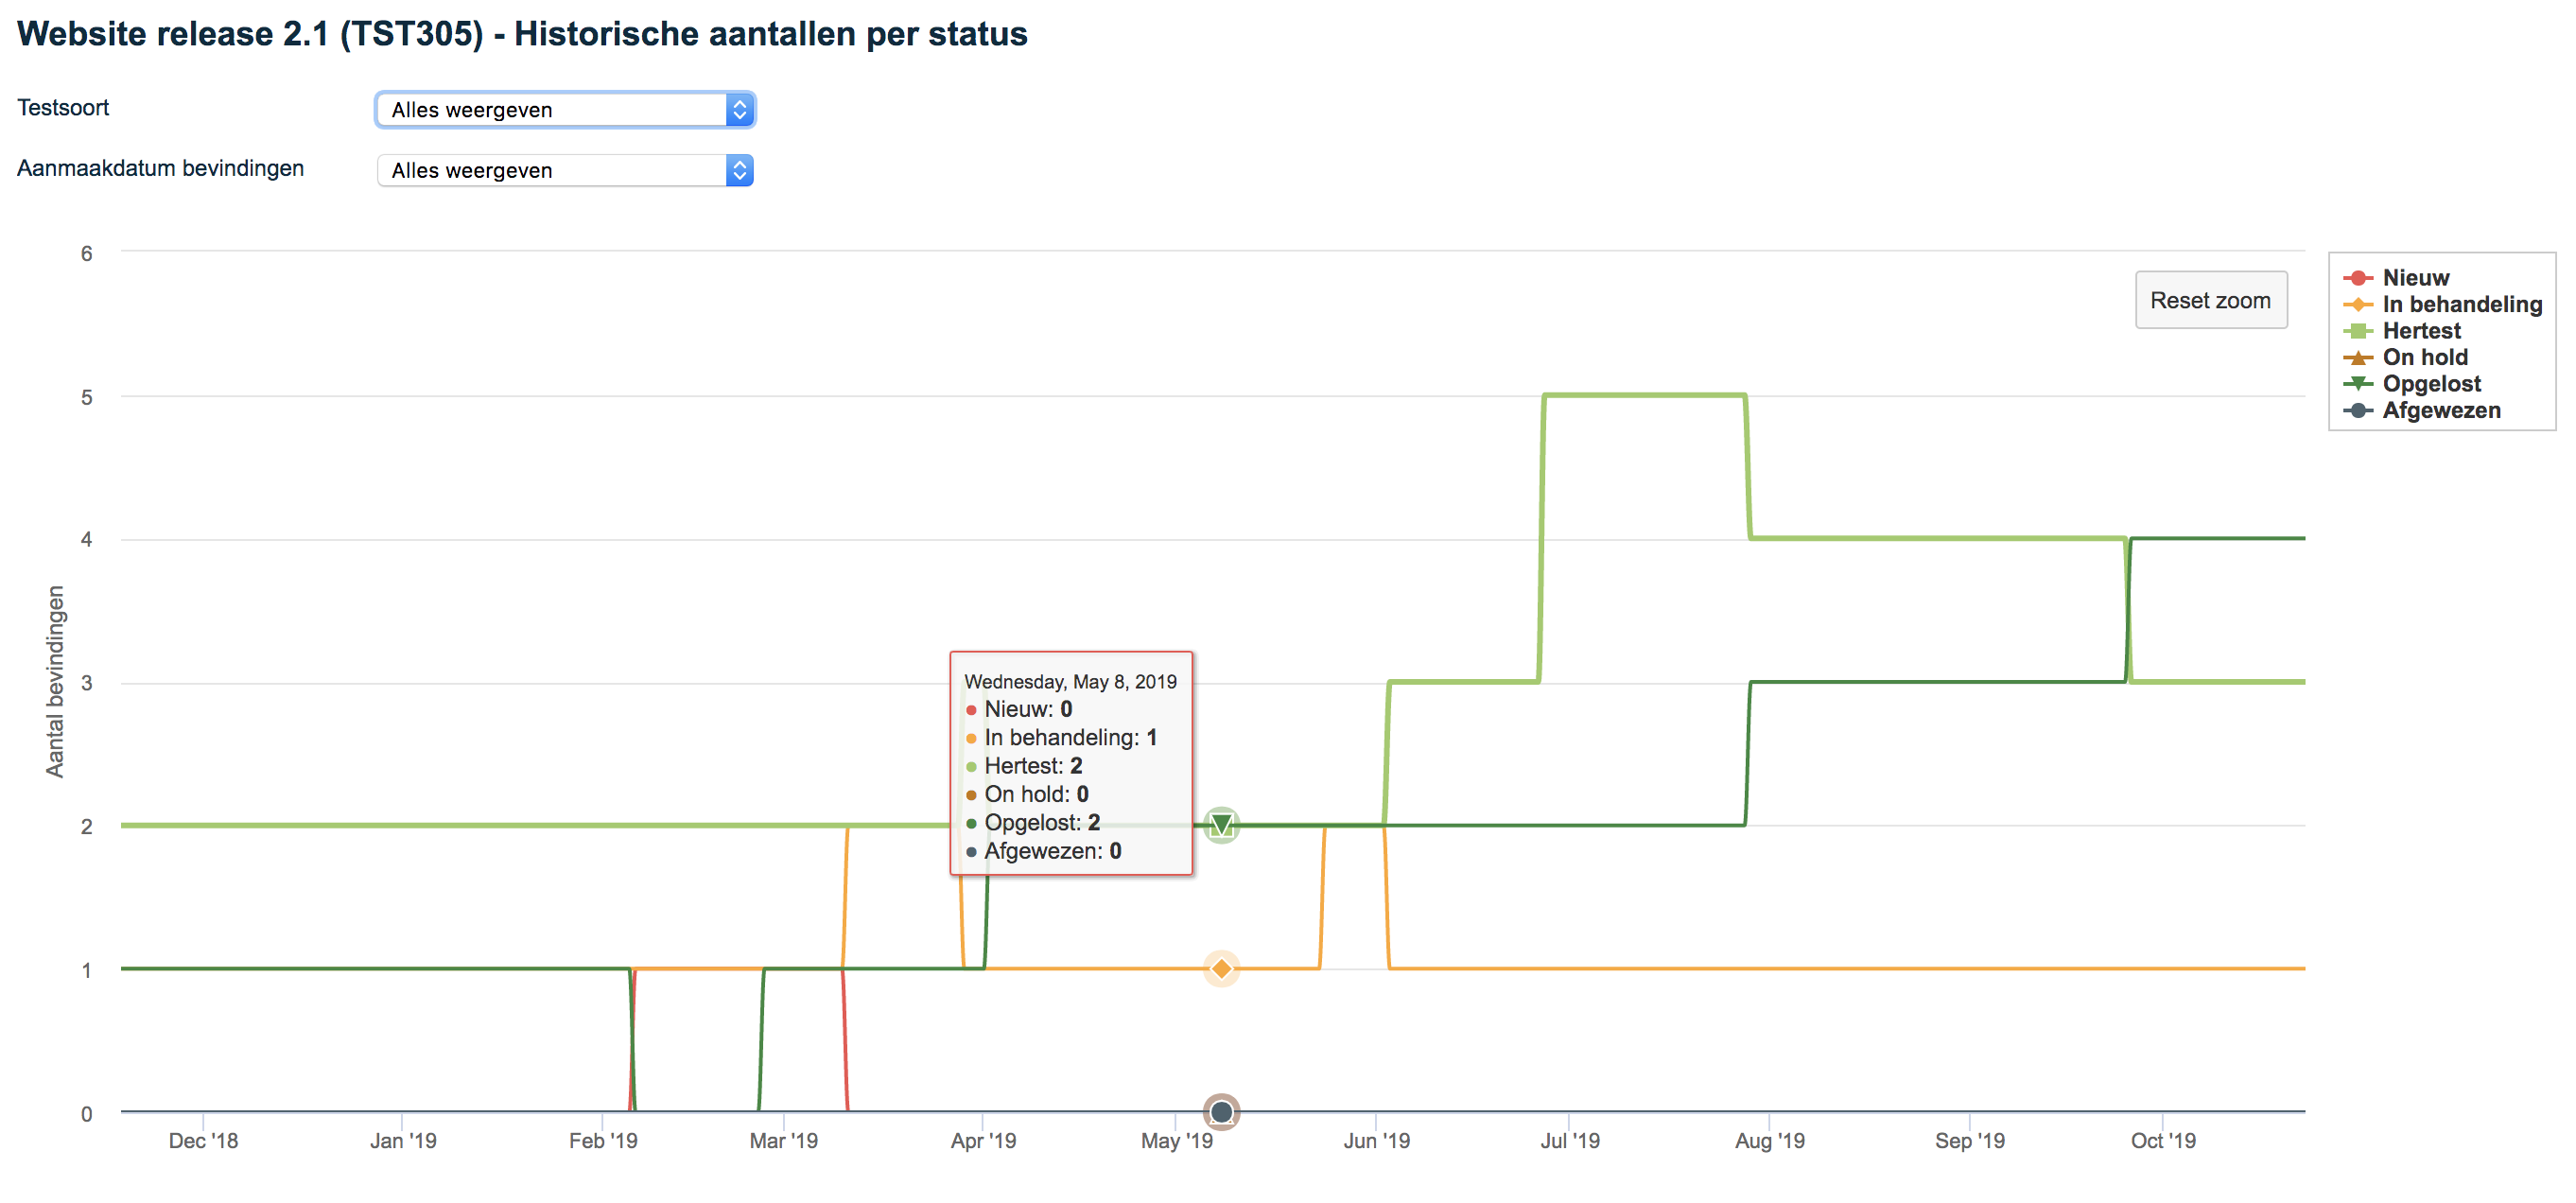
5. Historical Numbers by Status.
This report provides a historical overview of the numbers of statuses per day.
At the top of the report you can filter by:
- Test Type (Unit Test, System Test, etc.).
- Creation date defect (All, Today or Period)
This graph provides an additional option for filtering by clicking on and off the items in the legend on the right side of the graph.
Example of this report:
Zooming within the historical reports
The historical reports have the ability to zoom in on a time period by selecting an area. This can be done by dragging the mouse.
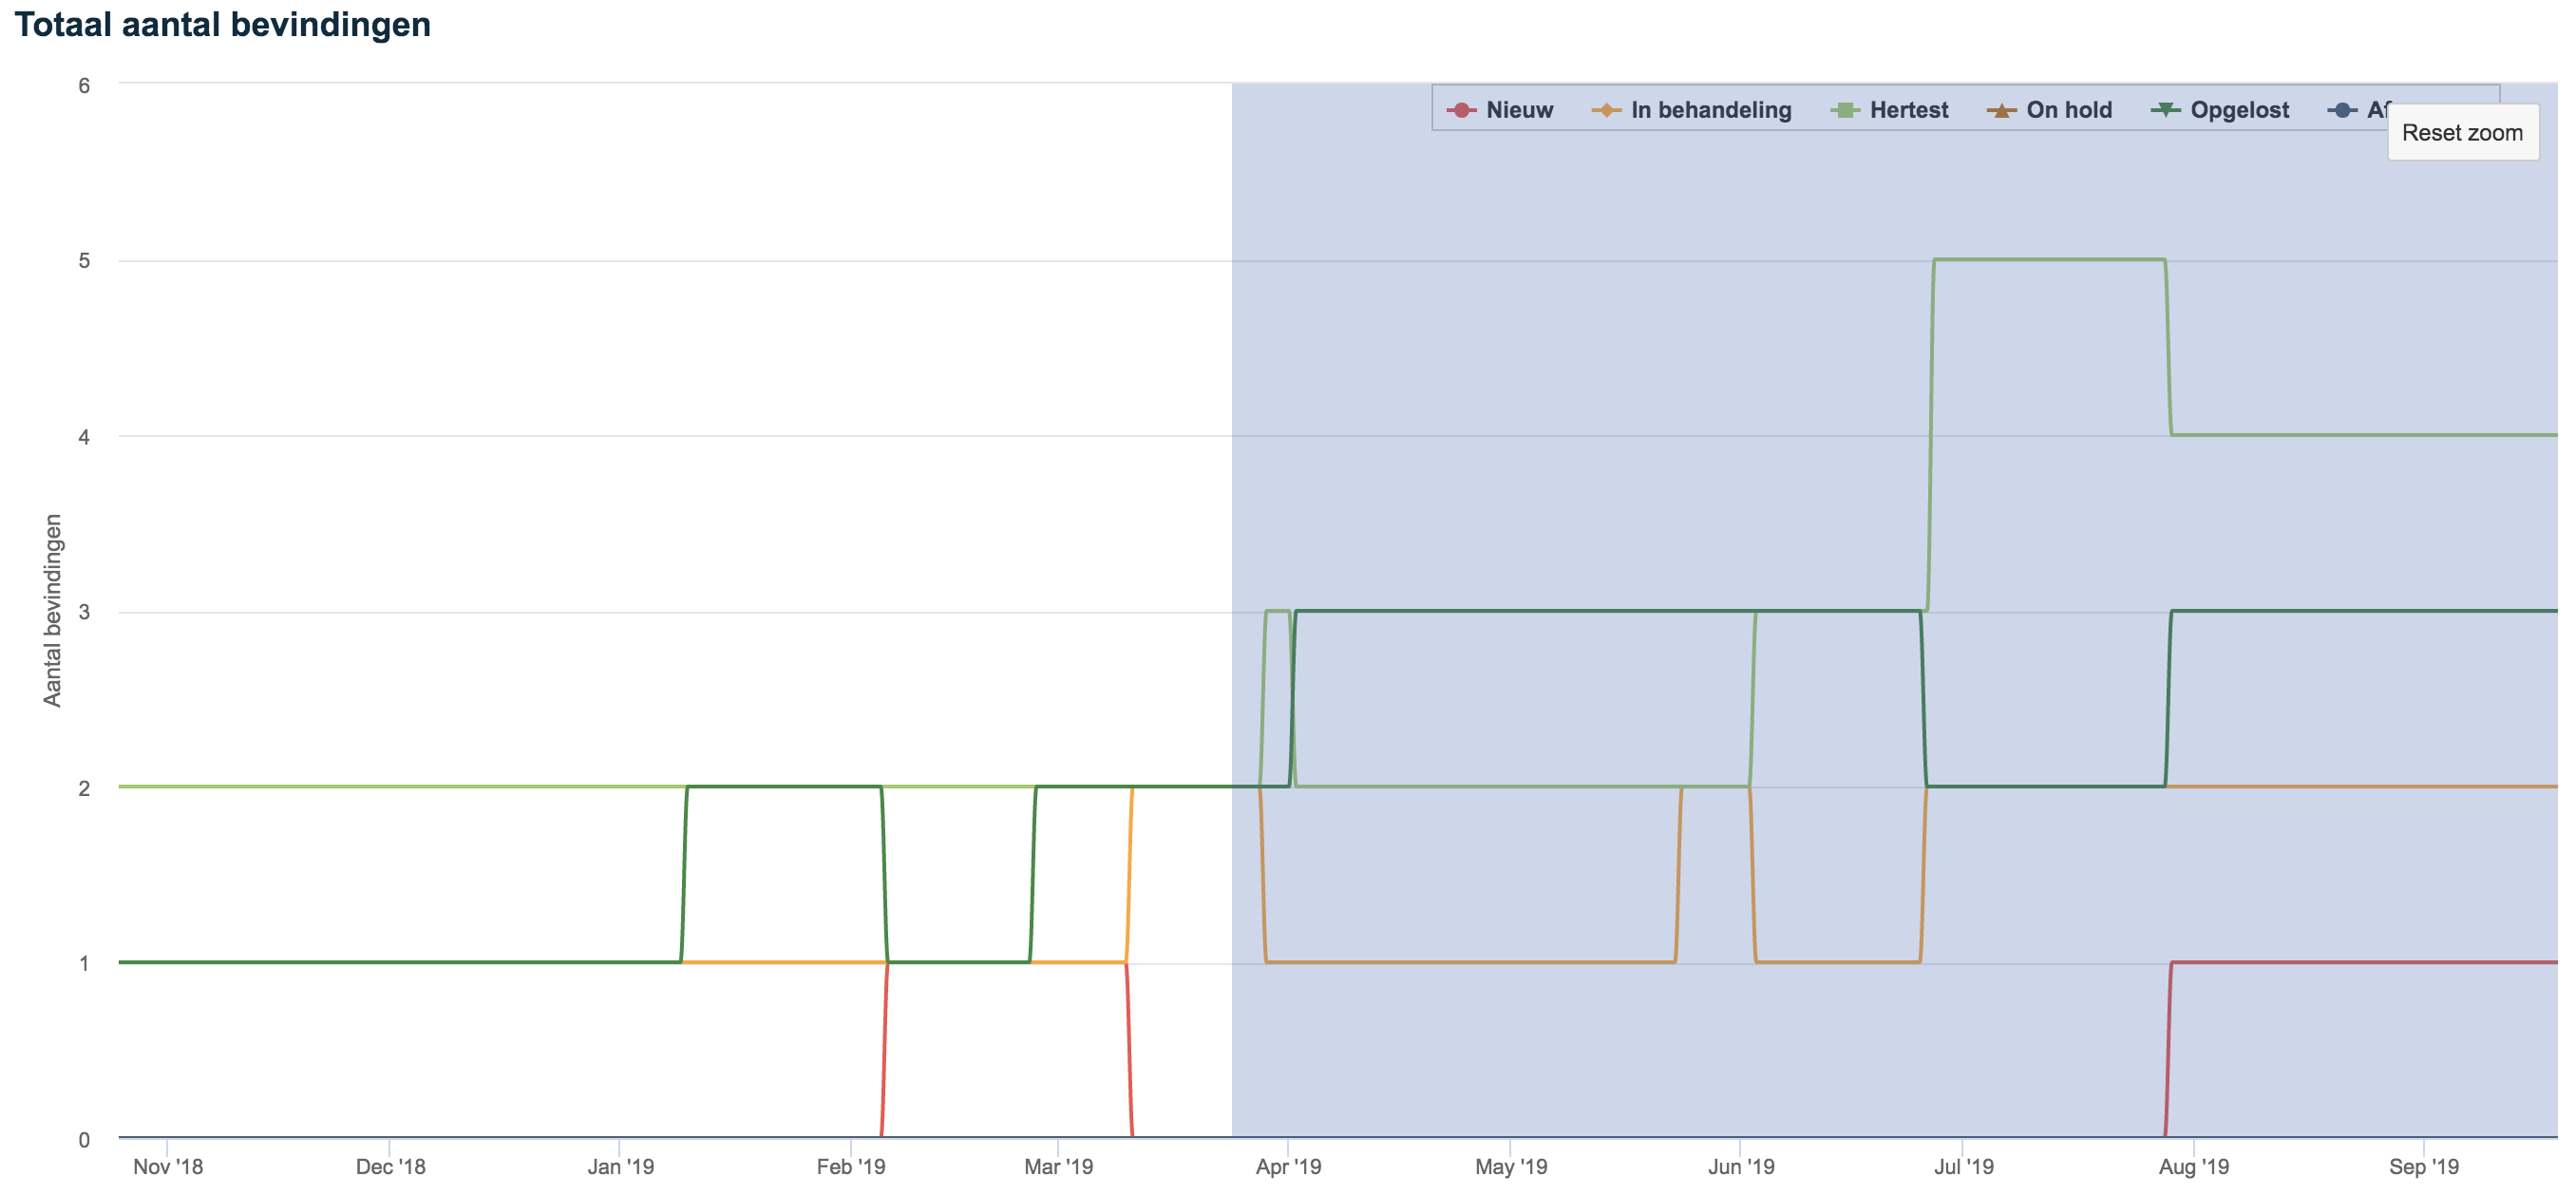
Then by clicking Reset zoom can be zoomed out again.