Six standard reports are available for the phase test execution in a Test cycle . If desired, you can generate these reports by test type. For example, do you want to know the progress of performing tests for the User Acceptance Test? Then select this test type in the report.

Test runs with Cancelled status are not shown in the test execution reports. You can manually set the status of test runs to Cancelled. See also Test run status.
Below is a description of the six test execution reports.
1. test execution progress
This report shows the test progress of test cases over time. This gives you a grip on the progress of the test execution as a whole. Use the filters to choose for which period and test type you want to see the report:

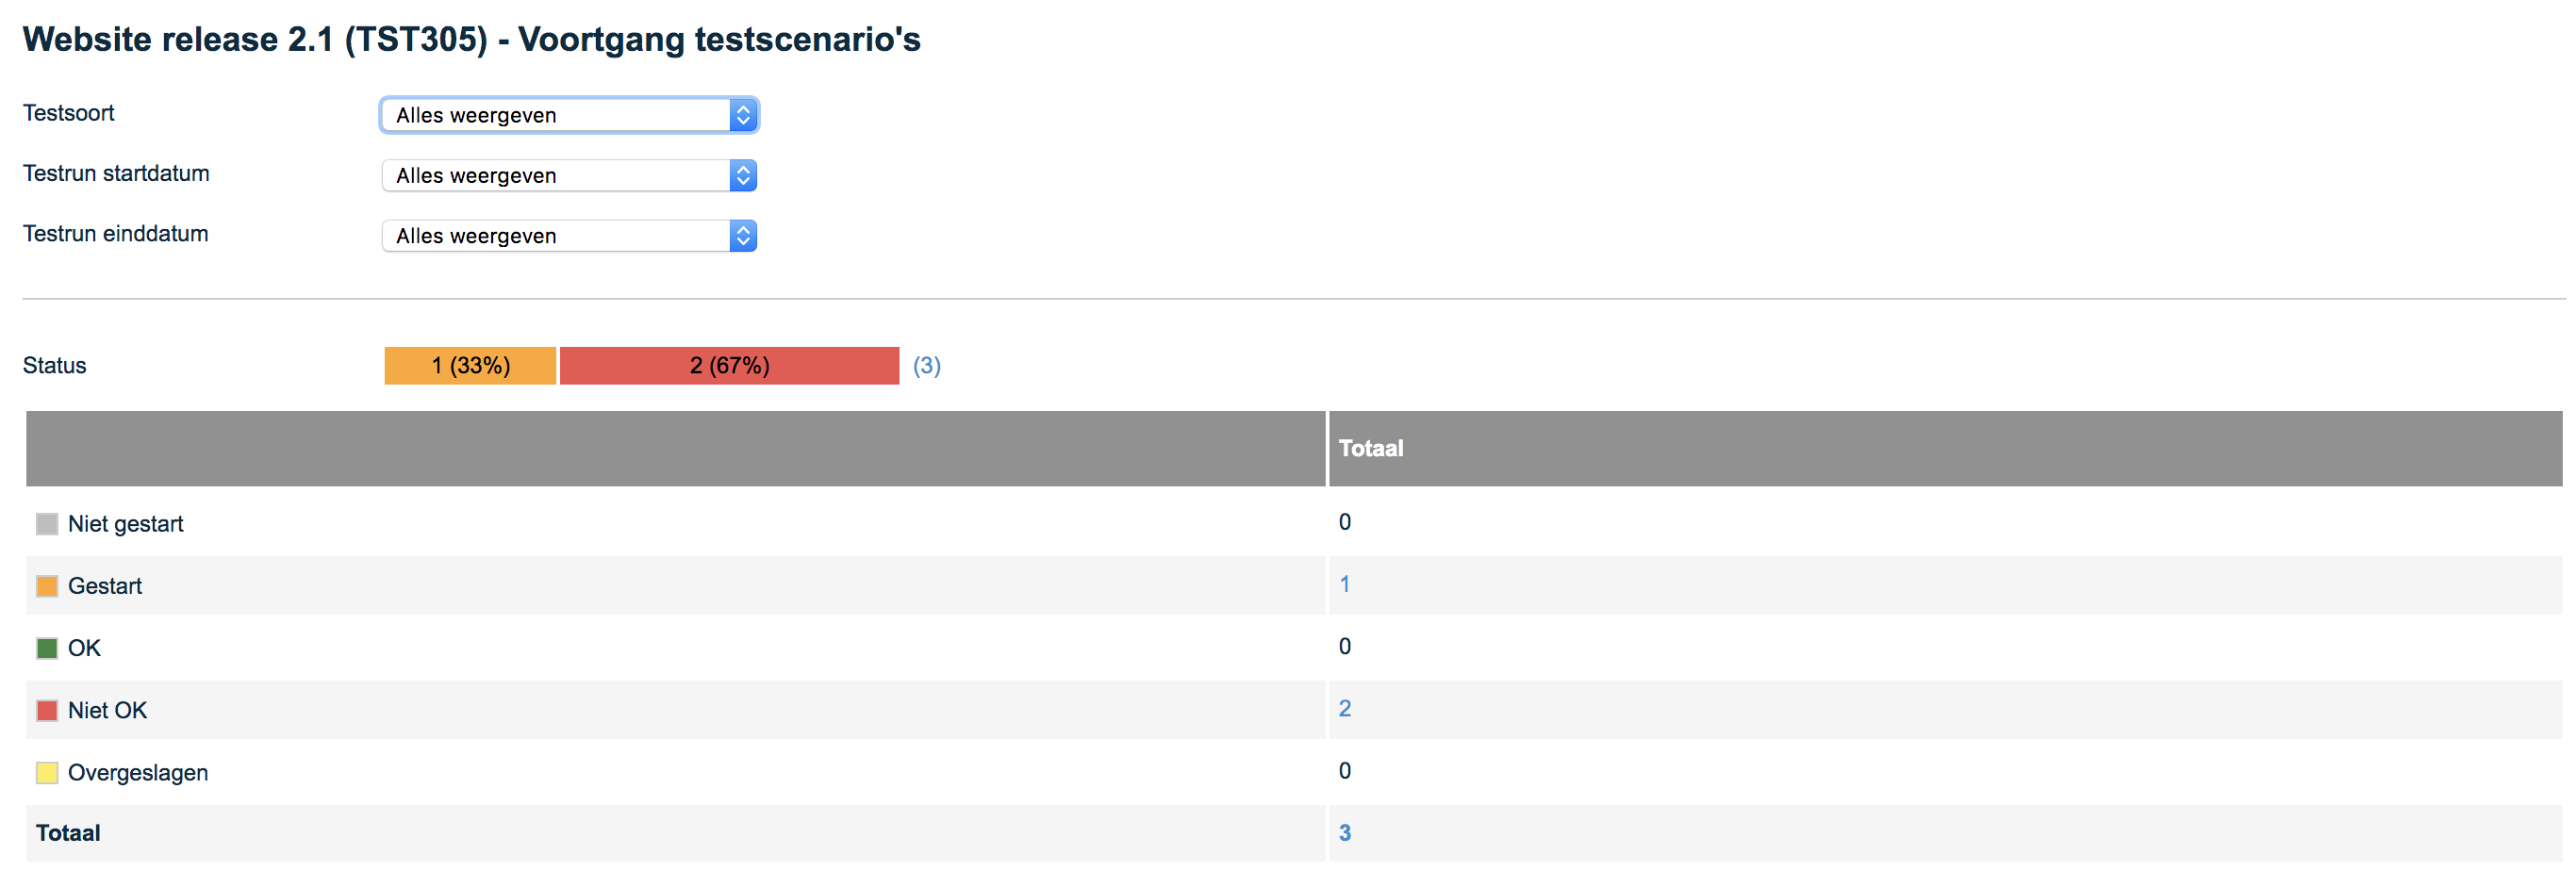
2. Progress of test scenarios
This report shows the progress of running test scenarios. For each status, the number of test scenarios is shown. The status of a test scenario is determined based on the statuses of the test cases in a test scenario. This works as follows:
| Situation | Test scenario status |
| All test cases have the status Not started | Not started |
| All test cases have the status Ok or Skipped | Ok |
| One or more test cases have the status Not Ok | Not Ok |
| All test cases have the status Skipped | Skipped |
| In all other cases | Started |
At the top of the report it is possible to filter by Test Type (Unit Test, System Test etc.)
Furthermore, it is possible to filter by start and end date of the test runs
Display options: table view only
Example of this report:
3. Progress of test cases per product risk
This report shows the progress of test cases per product risk. A classification is made based on the risk of the product to which a test case is related in combination with the execution status of the test case. If a test case is associated with a requirement then the risk is taken from the product the requirement is associated with. The report may show a No product risk category. Test cases can fall into that category for two reasons:
1. The test case has no relationship with a product (and therefore no product risk)
2. The test case has a relationship with a product but the product has no risk
At the top of the report it is possible to filter by Test Type (Unit Test, System Test, etc.)
Furthermore, it is possible to filter by start and end date of the test runs
Display Options: Bar graph, Table, Progress bars
The bar graph provides an additional option to filter by clicking on and off the items in the legend, to the right of the report.
Example of this report: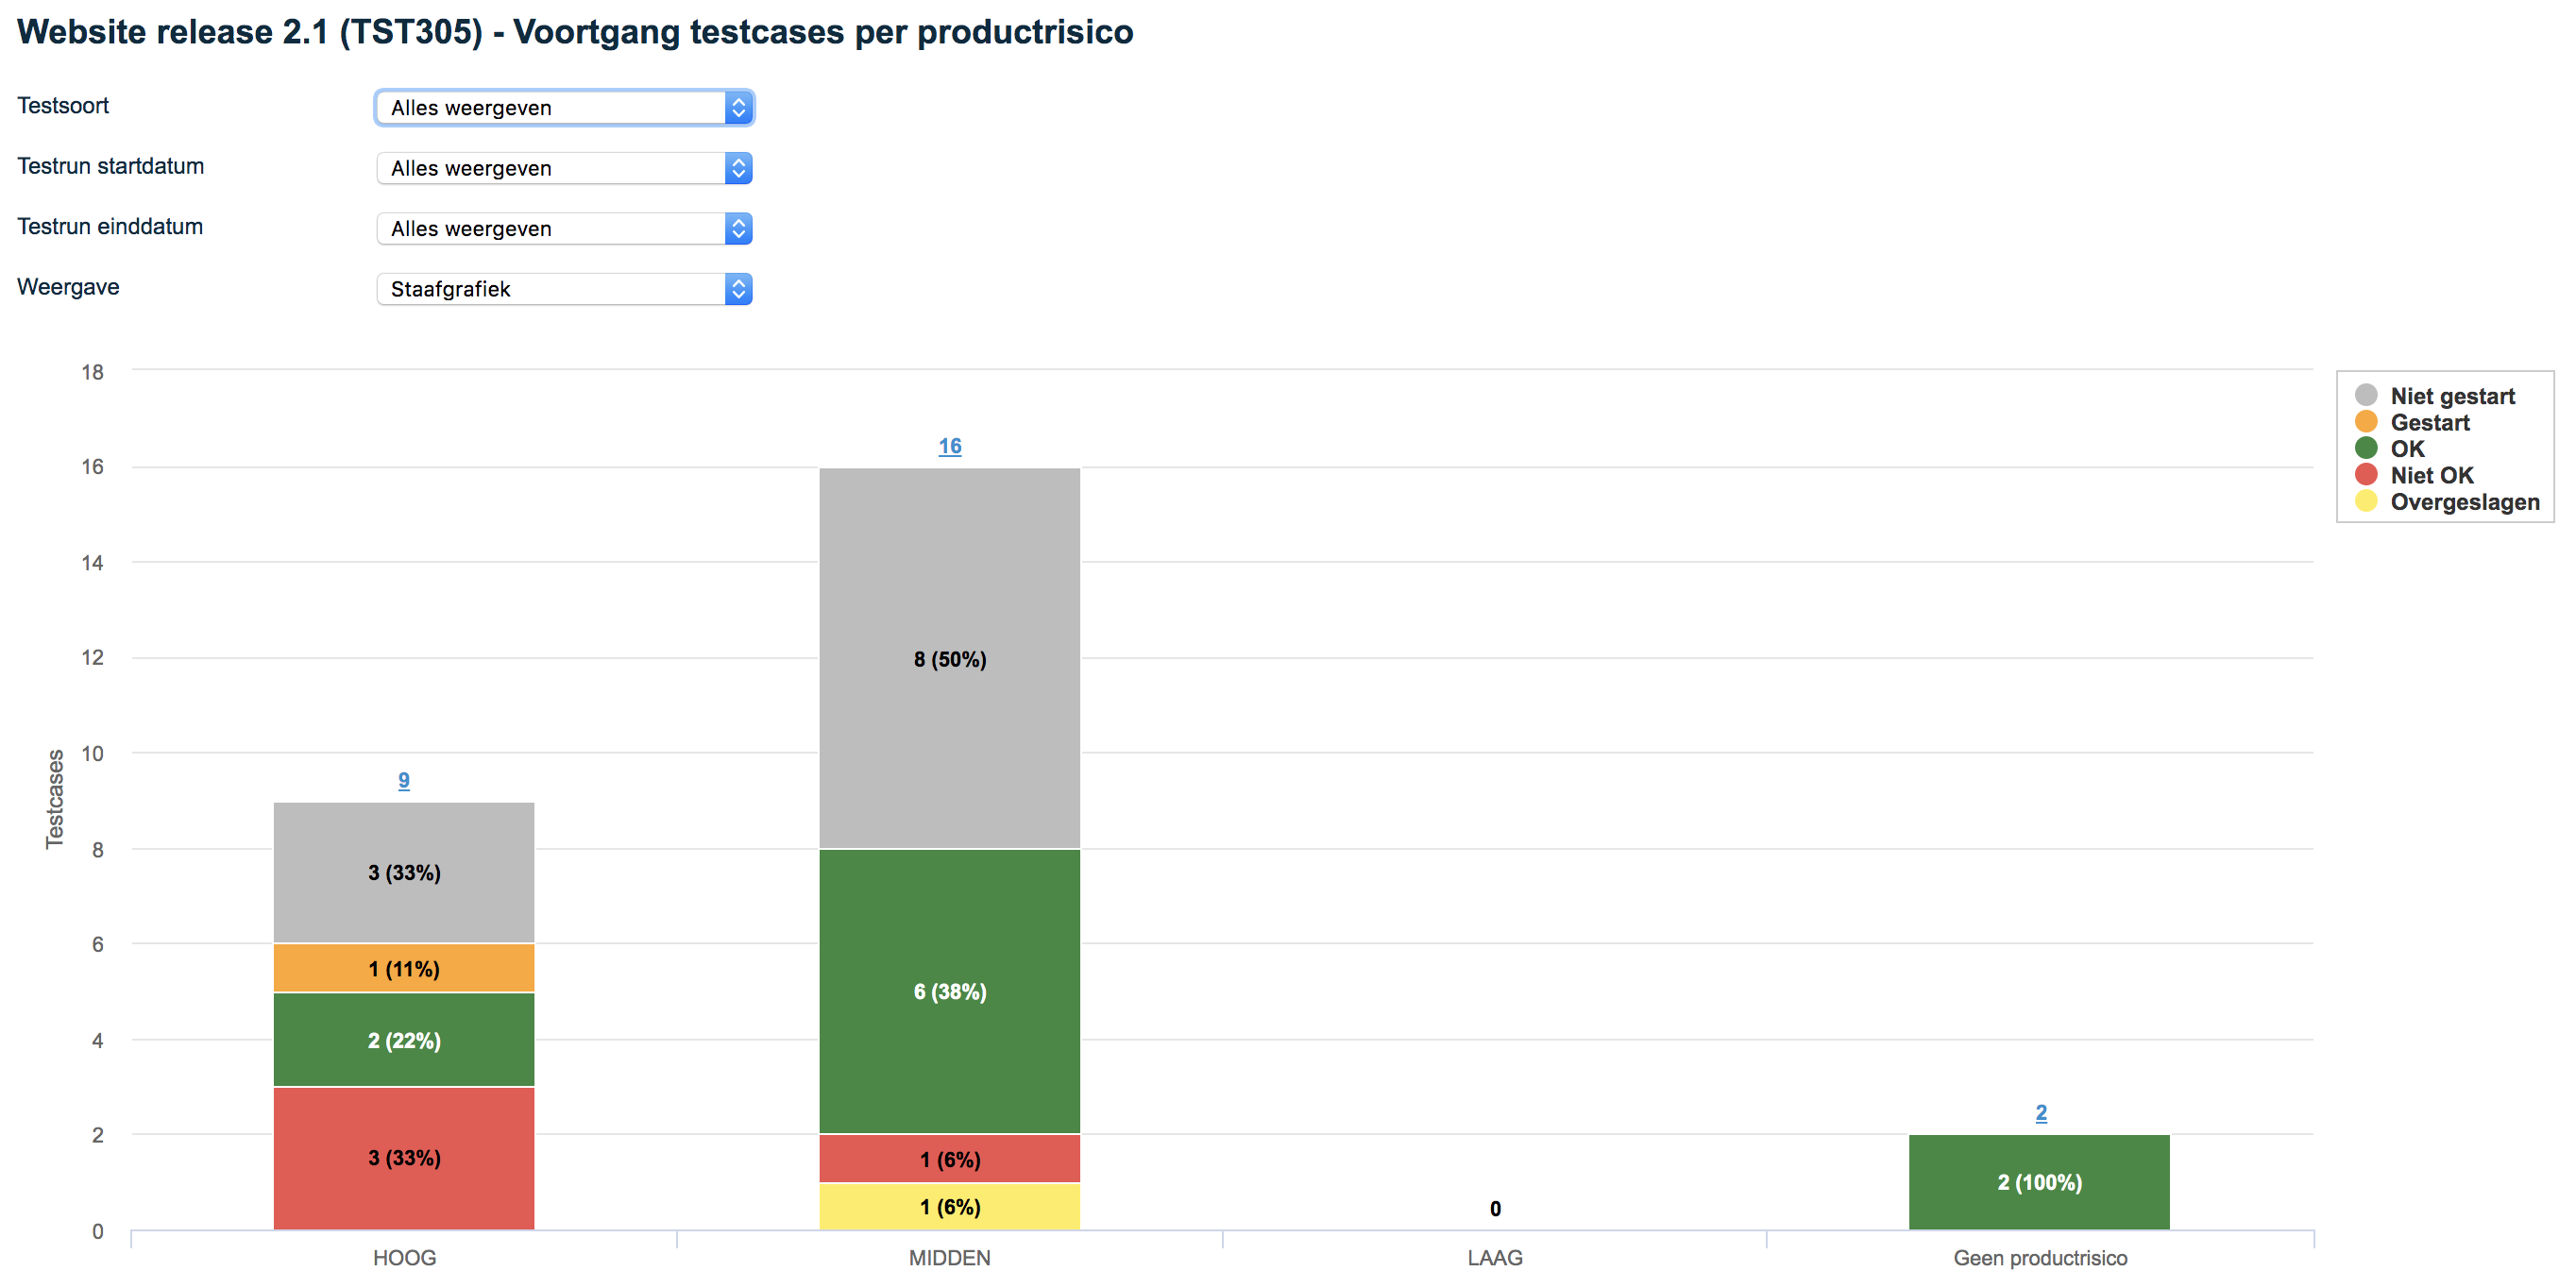
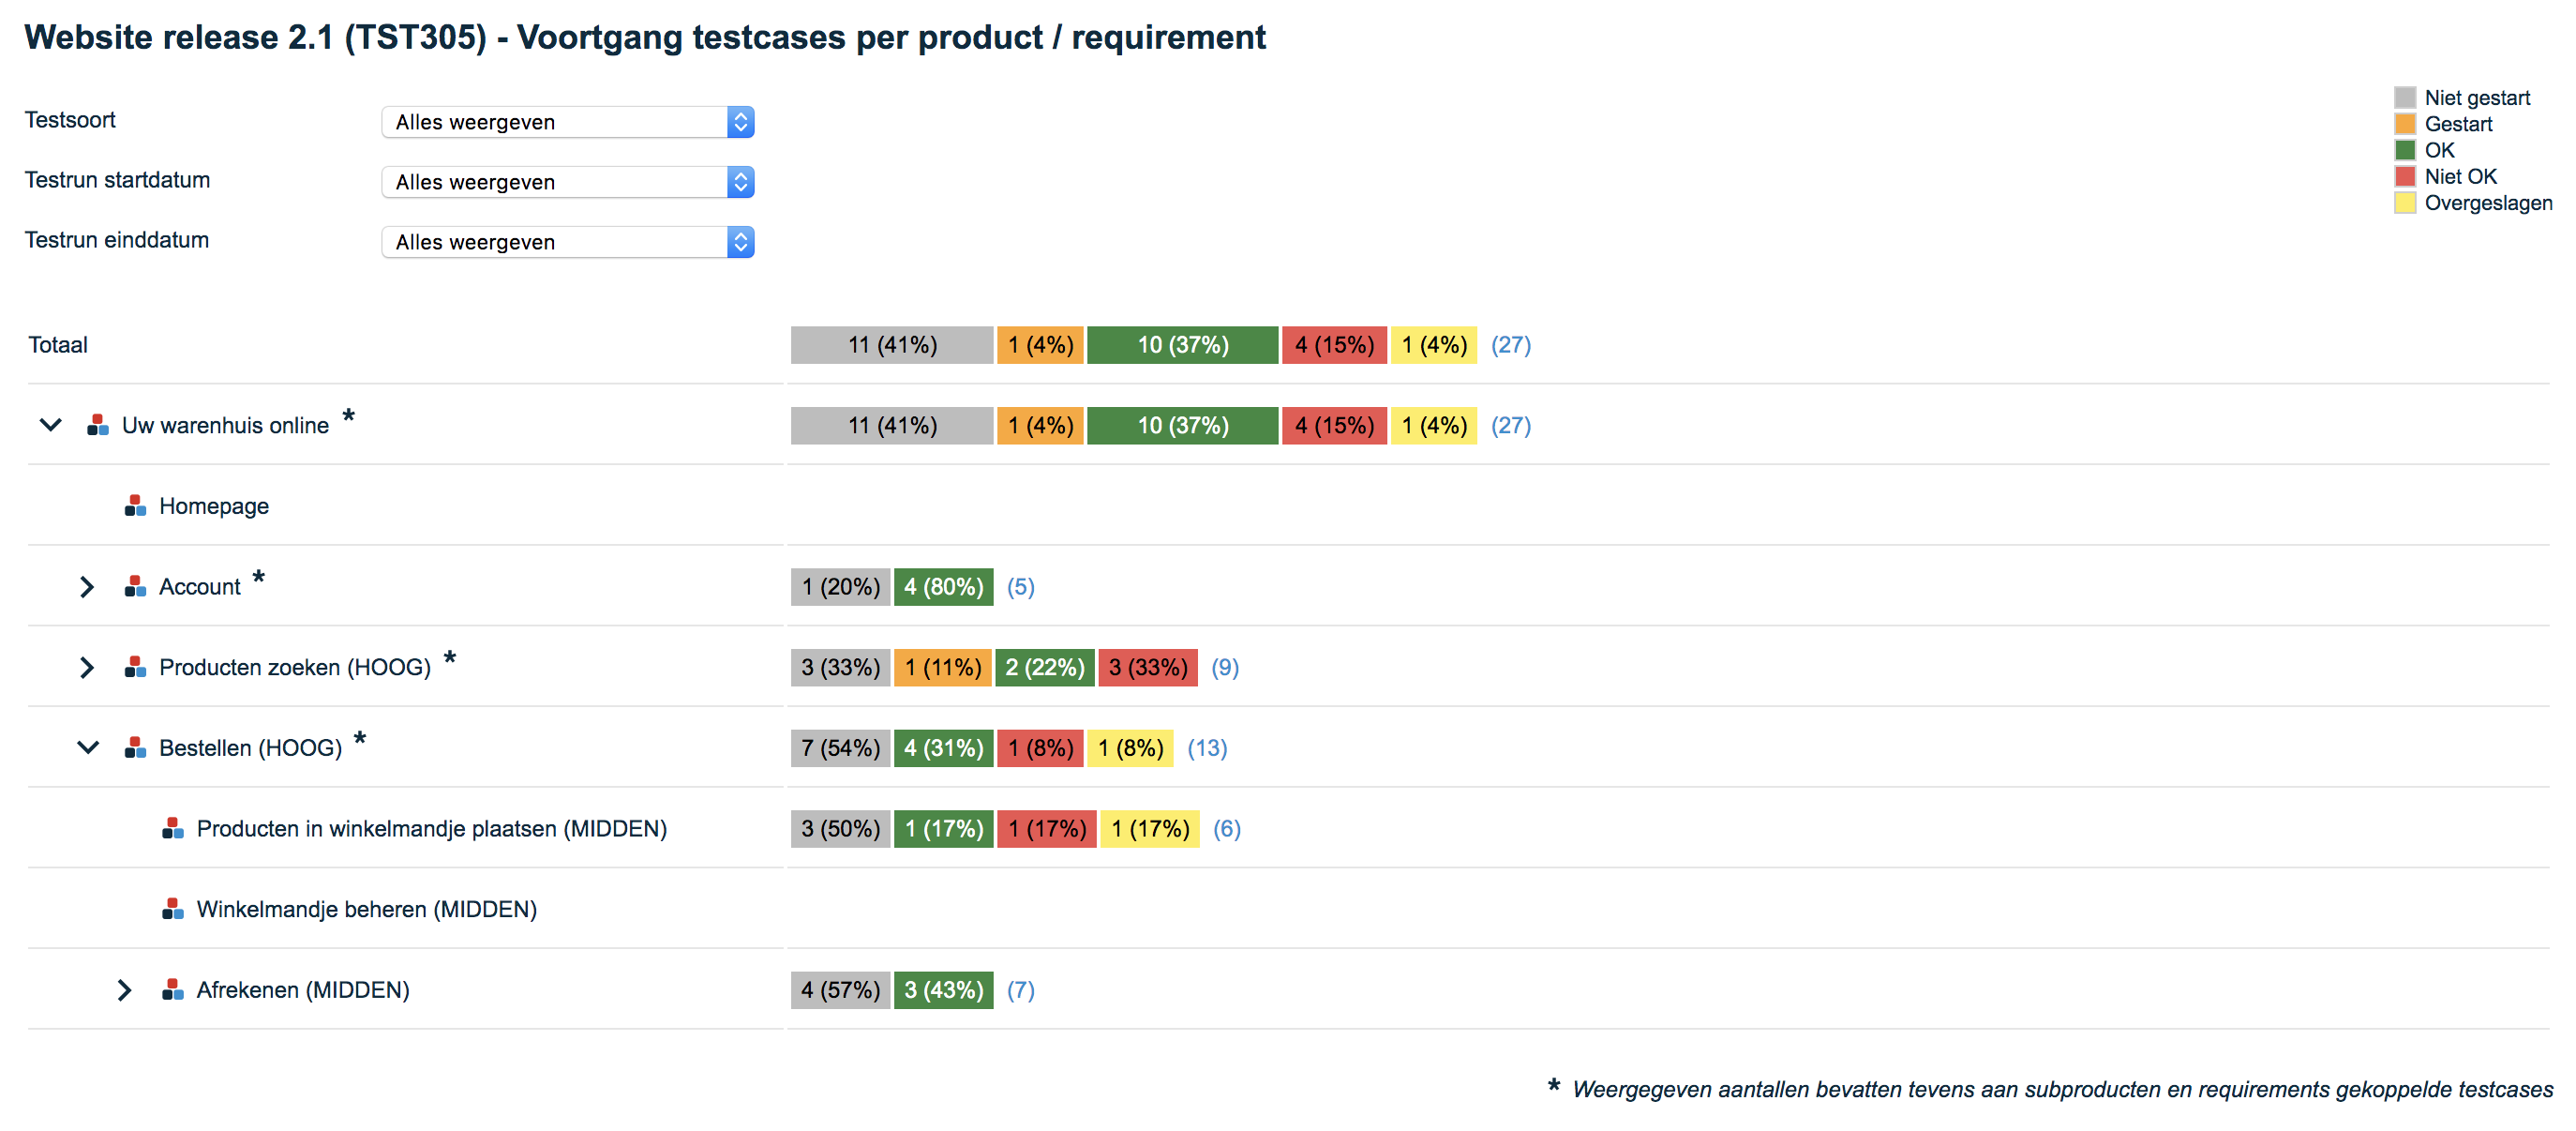
4. Progress of test cases per product/requirement
This report shows the progress of test case execution per product and requirement.
At the top of the report it is possible to filter by Test Type (Unit Test, System Test etc.)
Furthermore, it is possible to filter by start and end date of the test runs
Display options: tree view only
Example of this report:
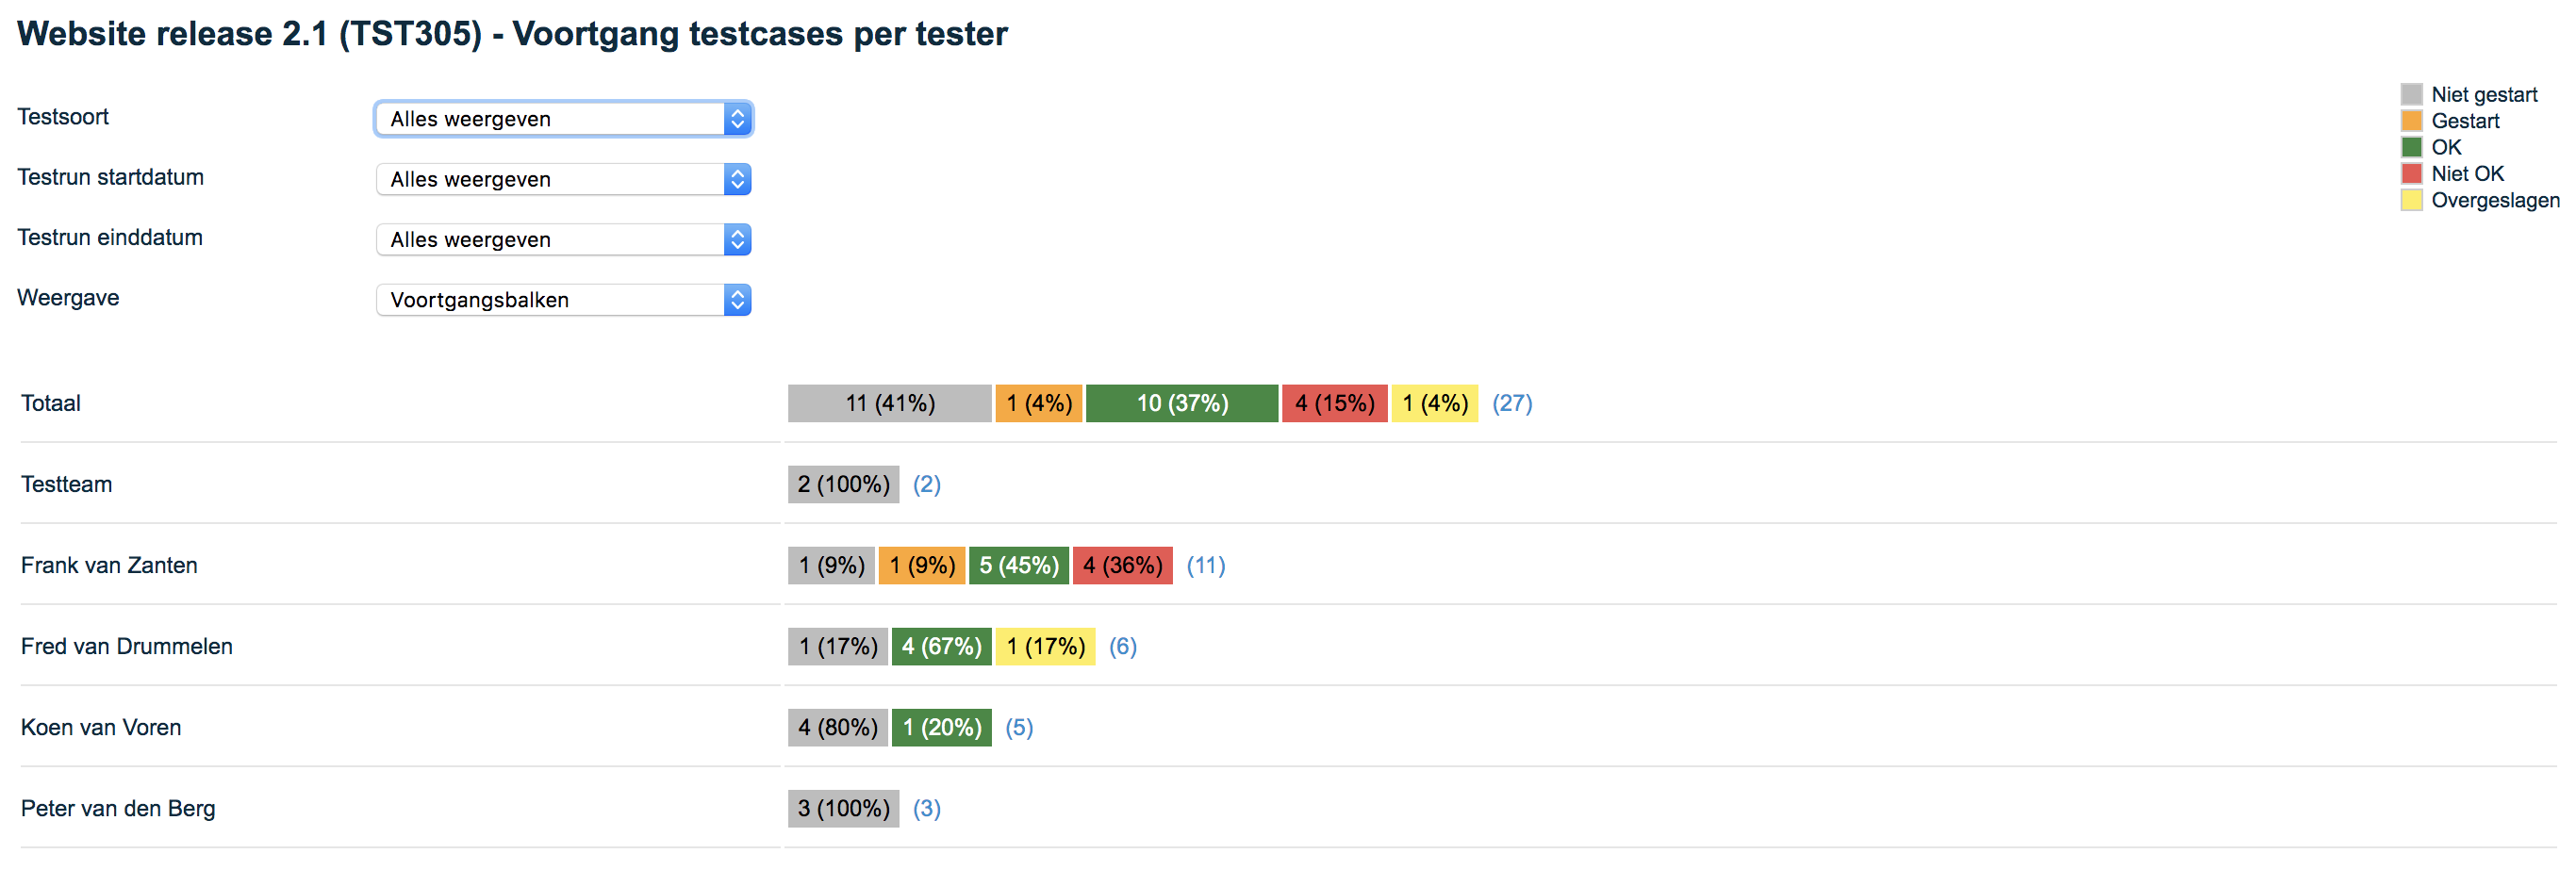
5. Progress of test cases per tester
This report shows the progress of executing test cases per tester.
At the top of the report it is possible to filter by Test Type (Unit Test, System Test, etc.)
Furthermore, it is possible to filter by start and end date of the test runs
Display Options: Bar chart, Table, Progress bars
Example of this report:
6. Progress test cases per product/requirement
This report works the same as the report '3. Progress test cases per product/requirement'. The difference is that this report does not show the number of test cases but the number of test steps within the test cases. This allows an even more detailed view of the progress. It may happen that there are large differences between the numbers of test steps per test case. In that case the report 'Progress of test cases per product/requirement' gives a less clear picture of the progress.
7. Progress test cases by tester
This report works the same as the report '4. Progress of test cases per tester'. The difference is that this report does not show the number of test cases but the number of test steps within the test cases. This allows for an even more detailed view of the progress. It may happen that there are large differences between the numbers of test steps per test case. In that case the report '4. Progress of test cases per tester' gives a less clear picture of the progress.